概览/摘要是任务1报告中非常重要的一部分。许多人在描述具体细节时没有困难,但他们发现很难描述图表、图表或图表的一般特征。下面是我如何写一个好的概述的技巧:
1.总是试着写两个句子。这迫使您描述图表、图表或图表的两个主要或一般特征。
2.不要在你的概述中输入任何数字。为“细节”段落保存特定的数字。
3.如果图表或图表显示了一个时间段(例如年),从一开始到结束(从第一年到最后一年)寻找总的变化。
4.寻找总体趋势,忽略不符合趋势的个人数据。例如,如果图表显示总体上升趋势,那么你可以忽略某个特定年份的数据减少,而那一年你的“细节”段落除外。
5.如果没有时间段显示,你就不能寻找趋势。相反,要寻找项目之间的异同。
6.不要在直线图上寻找单个“最高”或“最低”的数字,如“峰值”。相反,描述整体的最高和最低的项目(例如图表上哪一行在整个或大部分时间内是最高的?)。
7.用一个简单的短语开始你的概述,清楚地告诉考官这是你的摘要段落…值得注意的是…总的来说,我们可以看到…
8.如果有两种不同的图表,写一个关于每个图表的概述句。
9.如果有两个以上的图表,它们必须以某种方式连接起来,因此寻找两个主要特征。
10.如果任务是描述一个比较事物的图表或地图,那么您可以提到两个图之间的主要差异,可能是差异和/或相似性的数量。
11.如果任务是描述流程图,您可以提及流程中的阶段总数,并说明流程开始和结束的位置和过程。
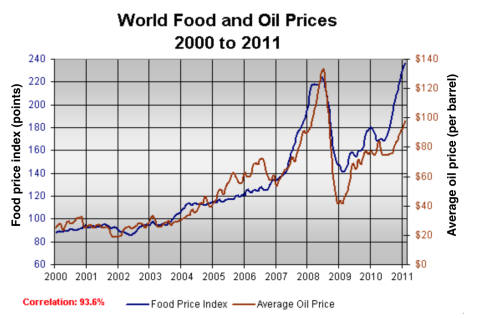
下面的图显示了在2000和2011之间的全球食品和石油价格的变化。
这是我的第一段,介绍和概述:
Paragraph 1
The line graph compares the average price of a barrel of oil with the food price index over a period of 11 years.
It is clear that average global prices of both food and oil rose considerably between 2000 and 2011, although many price fluctuations can be seen during those 11 years. Furthermore, the trends for both commodities are very similar, and so a strong correlation is suggested.
Paragraph 2
After writing your introduction and overview paragraphs, you need to describe the information in detail. Here are my tips for describing line graph details:
在编写介绍和概述段落之后,您需要详细地描述这些信息。下面是我描述线图细节的技巧:
1》Try to write two paragraphs. This isn’t a ’rule’, but it’s a good idea because it forces you to group the information, and this should improve the organisation and coherence of your report. One big paragraph full of numbers can look messy, whereas two separate paragraphs will look neater and be easier to read.
试着写两段。这不是一个“规则”,但它是一个好主意,因为它迫使你对信息进行分组,这将改进报告的组织性和连贯性。一大段充满数字看上去很凌乱,而两个独立的段落的外观简洁、易于阅读。
2》Aim for just two or three sentences in each ’details’ paragraph. Some of your sentences will be quite long, because you’ll be comparing several numbers, so two sentences can sometimes be enough.
在每个细节段落中只写两到三句话。你的一些句子会很长,因为你要比较几个数字,所以两句话有时就足够了。
3》Always compare the lines; never describe each line separately.
总是比较行;不要分别描述每行。
Select key numbers only. You won’t have time to describe every number in every year.
只选择键号。你不会有时间来描述每年的每一个数字。
4》Start at the beginning, with the first year on the left of the x axis. Compare the numbers (i.e. all lines) in that year.
在开始时,在x轴左边的第一年开始。比较那一年的数字(即所有的线)。
Then choose an interesting point towards the middle of the graph, and compare the figures at that point.
然后在图的中间选择一个有趣的点,比较那个点上的数字。
5》OR: Summarise the line trends over the first half of the period (to somewhere around the middle of the graph).
或者:总结这一时期前半段的趋势(到图中间的某个地方)。
6》Then start a new paragraph for the second half of the time period.
然后在这段时间的后半段开始一段新的段落。
7》Compare the figures for all of the lines at any key points. Or summarise the line trends over the second half of the period.
比较所有关键点上的线的图形。或总结该时期后半段的趋势。
8》Finish at the end, with the last year shown. Compare the numbers (i.e. all lines) in that year.
结束时,与去年显示。比较那一年的数字(即所有的线)。
Here’s a short version of the advice above:
下面是以上建议的一个简短版本:
Paragraph 3
Compare the lines (giving numbers) in the first year shown, then describe any significant numbers or overall trends in the first half of the time period.
比较在第一年显示的数字(给出数字),然后描述时间段前一半的重要数字或总趋势。
Paragraph 4
Describe any significant numbers or overall trends in the second half of the time period, then compare the lines (giving numbers) in the last year shown.
描述下一段时间的任何重要数字或总趋势,然后比较去年的线(给出数字)。