柱形图属于动态图。柱形图则重于数据的呈现,下面华盟就带你从一篇范文分析雅思柱状图该怎么写
The bar chart below shows the production of energy produced by wind in four different countries from 1985 to 2000.
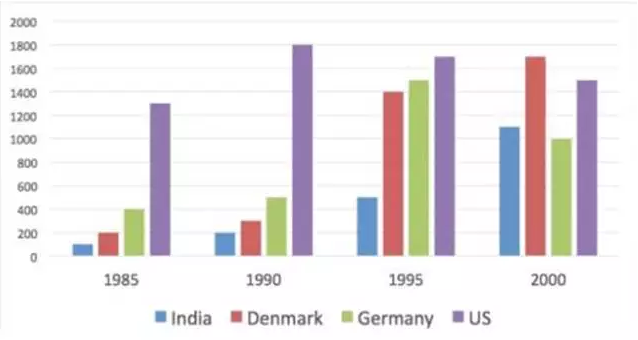
The bar chart illustrates the energy production stemming from wind in four different countries in every four years from 1985 to 2000.
India and Demark produced increasing amount of energy within the 20 years. For the former, less than 100 units of energy were generated from wind before rising dramatically to 1100 units in the later period. In terms of Demark, the wind-producing energy was also not much compared with other developed countries, albeit the fact that the production soared to 1400 units in 1995 and in 2000, Demark boasted the largest quantity of energy production from wind, at 1700 units.
The 20 years witnessed the same pattern for the change of energy in the USA and Germany, both experiencing a rise and then a fall. The USA was the country where a largest quantity of wind energy was produced except the last year, with 1200 units generated in 1985 and 1500 units deriving from wind. Germany showed the similar situation, and it was noticeable that there was a notable drop over the last five years.
In general, wind power gained growing popularity with years going by.
雅思作文柱状图中,柱子间差距的大小和变化总是会成为一个隐藏的重要信息点,如果雅思考生们能有意识去发现差距所代表的信息点,那么柱状图的高分就不难被斩获了。(雅思小作文各种类型可以微信关注华盟教育微服务,9.9元雅思听说读写全面教学)
以下是老师柱状图讲解视频: